There are two types of machine learning algorithms. Supervised and Unsupervised. Lets look at both
Regression Problem -> Predict real valued problem
Classification Problem -> Predict discrete values
Learn from data how to predict
m = mumber of training examples. Together called a training set
x = input variables or features
y = output variables or target variable
(x, y) -> one training example
(x(i), y(i)) = ith training example (ie ith row)
The training set and the learning algorithm together help to create a Hypothesis function (h) or what we refer to above as a model. And this when fed with features of new "experiments" (i.e new measurements about another item that we are trying to predict a class or value of) the model is able to predict the class or value ie the target.
The hypothesis function is represented as
hθ(x)=θ0 + θ1x
This is also referred to as Linear Regression with 1 variable or Univariate Linear Regression
Here θi's are parameters of the Linear regression with one variable Model. So the problem boils down to "How to choose θ0 and θ1 so that the model from this equation hθ fits the data well.
In classification we are predicting a discrete value of a particular type. For example when we observe the weather conditions and predict if it will "rain" or "not rain" the type is "Whether it will rain". This is the class column. The value that we predict is the label of that column. So we are predicting a class label. Now the class can be of as little as two values (as in this example of rain or not rain) and it is referred to as binary classification or more than that. When multiple values are possible its called multiclass classification problem. Since we are talking about fitting lets define that too. Whenever we find that a model we create using the training set and algorithm is able to make accurate predictions on the new experiments it is a good fit and so we say that the model is able to generalize from the training to the test set. When a model becomes too complex it is called overfitting and when a model is too simple it is called underfitting.
So coming back to our hypothesis function hθ we need to train it so that it is as close as possible in its predictions of the target values to the actual values in the training set. So if hθ(x(i)) are the values predicted by the model and if y(i) are the actual values of the targets in the training data set, we want to caculate the difference between the two and minimze the differnce so that the model fits as closely to the training data set as possible.
So this now becomes a minimization problem. What are we trying to minimize the difference in the predictions and the actuals. To do this we write a "Cost Function" which is the Sum of the squares of the difference between the predicted and actuals and the whole thing divided by 2 times the number of training values. As we try different values for θ0 and θ1 the value of the cost function changes and we look for the pair of θs so that the value of the cost function is at its least. The value of the cost function traces a plot. Depending on whether we are dealing with only one θ or two we may have a parabola plot or a contour plot. In the case of a parabola we look for that value where the cost function J which describes the slope of the plot approaches zero. In the case of a contour plot we look for those values of θ such that the contour plot described by J is the innermost.

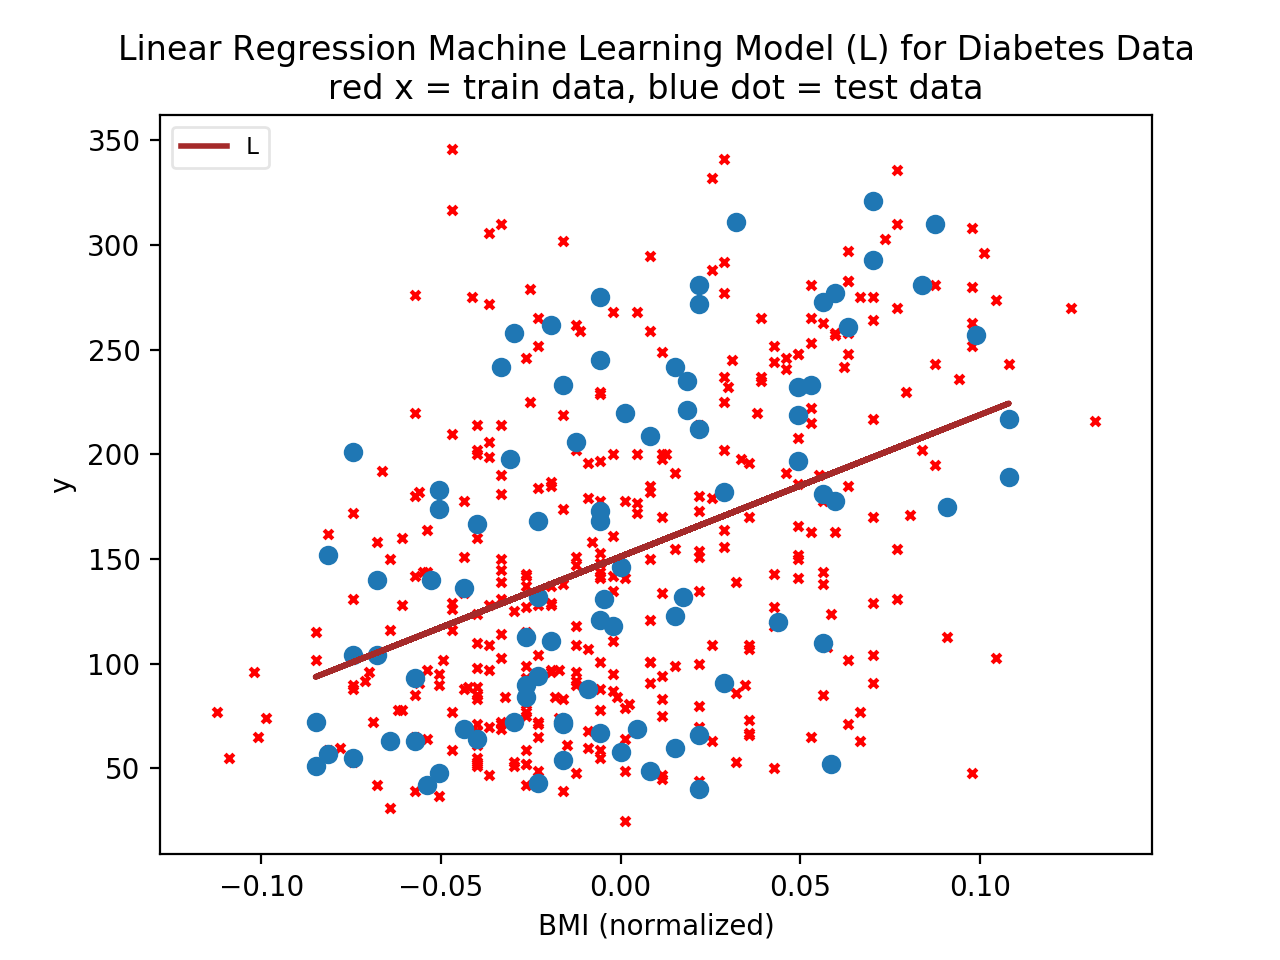
Let's first examine the data. The data here is the diabetes dataset. Examining the dataset Bunch object:
from sklearn import datasetsTo view the raw data
print dir(datasets.load_diabetes())
print dir(datasets.load_diabetes())Description of the dataset. Here's a link to the paper.This website has more information on this dataset. The dataset in scikit-learn is standarized (zero mean and unit L2 norm). cf http://www.stanford.edu/~hastie/Papers/LARS/ It is the same data as in http://www4.stat.ncsu.edu/~boos/var.select/diabetes.html, but this one (ncsu version) is standarized. (cf 3rd point in http://www.stanford.edu/~hastie/Papers/LARS/) The data in sklearn has therefore lost its physical meaning (age, sex, bmi, blood pressure, ...) Here is a tab separated listing of the data. Here is the description of the load_diabetes function.
Copyright (c) 2016 vijaigandikota.com. All rights reserved. | Photos by Vijai Gandikota | Design by Vijai Gandikota.com.